

Browse our data and maps repository, where you can find a variety of information on Chandler's business environment and the advantages of doing business in our community.
Chandler Data & Maps
Chandler is home to nationally recognized employers representing a wide range of industries. Download our Leading Employer List for employment counts and our Business News document for information on business attraction and expansion projects.
Our corporate-friendly environment is highlighted by the fact that more than 30 companies on the 2023 Fortune 1000 list have office locations in Chandler. Together, these companies have more than 35,000 employees in Chandler, which translates to about 30% of citywide employment. Companies are listed below with Fortune 1000 rank in parentheses.
- CVS Health (6)
- Alphabet - Waymo subsidiary (8)
- Cardinal Health (14)
- General Motors (21)
- Verizon (26)
- Walgreens (27)
- Bank of America (32)
- Wells Fargo (47)
- Intel (62)
- Allstate (84)
- Liberty Mutual (86)
- Qualcomm (98)
- Northrop Grumman (113)
- Honeywell International (115)
- Broadcom (123)
- PayPal (148)
- Avnet (163)
- CDW (166)
- Charles Schwab (175)
- Western Digital - SanDisk subsidiary (221)
- Stryker (224)
- Stanley Black & Decker (227)
- Republic Services (309)
- Air Products & Chemicals (322)
- Analog Devices (344)
- Insight Enterprises (379)
- Crown Castle International (513)
- Microchip Technology (522)
- Ametek (570)
- Voya Financial (579)
- Qorvo (676)
- Snap (684)
- Comfort Systems USA (728)
- Mr. Cooper Group (992)
Chandler is an attractive, diverse, educated and growing community. Download our Demographics One-Pager for information on population growth, income levels and our community's workforce. We also can provide custom data reports on request.
There is about 12 million square feet of office space in Chandler, offering everything from corporate campuses to executive office suites. See below for an interactive virtual tour of some office projects that are at least 20,000 square feet.
There is more than 26 million square feet of industrial space throughout Chandler, with buildings suitable for high-tech manufacturing, assembly, distribution and other uses. See below for an interactive virtual tour of some industrial projects that are at least 20,000 square feet.
There are a number of coworking spaces in Chandler. See below for an interactive virtual tour.
Chandler has five designated employment corridors: Airpark Area, Downtown Chandler, Price Corridor, Uptown Chandler and West Chandler. In these areas, current business activity and land reserved for future employment uses are most concentrated. Download our employment center sheets for area data along with maps showing some of the leading businesses.
Chandler continues to experience population growth and residential developers are delivering new projects to meet demand for housing. Download our housing projects maps for information on projects that are planned, under construction and recently completed.
Visitors to Chandler have many options for overnight accommodations. Take an interactive virtual tour of Chandler's existing hotels. See below for a complete listing that includes number of rooms at each and total room count.
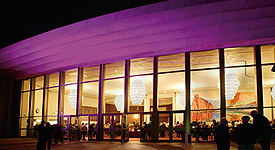
VisitChandler.com for things to do, events, restaurants and shopping in Chandler.
| Hotel | Rooms |
|---|---|
| Aloha Motel | 26 |
| Best Western Inn of Chandler | 47 |
| Cambria Hotel Phoenix Chandler-Fashion Center | 136 |
| Chandler Inn | 25 |
| Casa Blanca | 24 |
| Comfort Inn Chandler | 129 |
| Courtyard Phoenix Chandler Fashion Center | 150 |
| Crowne Plaza Resort Phoenix-Chandler Golf Resort | 249 |
| DoubleTree by Hilton Phoenix Chandler | 160 |
| Drury Hotels Phoenix-Chandler Fashion Center | 210 |
| Element Chandler Fashion Center | 107 |
| Extended Stay America-Phoenix-Chandler Downtown | 136 |
| Fairfield Inn & Suites Phoenix Chandler Fashion Center | 110 |
| Hampton Inn & Suites Phoenix Chandler Fashion Center | 153 |
| Hampton Inn Phoenix Chandler | 101 |
| Hilton Garden Inn Chandler Downtown | 110 |
| Hilton Phoenix Chandler | 197 |
| Holiday Inn & Suites Phoenix Chandler | 106 |
| Home 2 Suites Phoenix Chandler | 126 |
| Homewood Suites Phoenix Chandler | 83 |
| Homewood Suites Phoenix Chandler Fashion Center | 133 |
| Hyatt Place Phoenix Chandler Fashion Center | 129 |
| Marriott Phoenix Chandler | 264 |
| Motel 6 Chandler | 47 |
| Quality Inn Chandler | 70 |
| Redwood Motel | 20 |
| Residence Inn Phoenix Chandler South | 142 |
| Residence Inn Phoenix Chandler Fashion Center | 102 |
| Sonesta Select Phoenix Chandler | 155 |
| SpringHill Suites Phoenix Chandler Fashion Center | 101 |
| Staybridge Suites Phoenix Chandler | 104 |
| Super 8 Chandler Phoenix | 73 |
| TownePlace Suites Phoenix Chandler/Fashion Center | 109 |
| Wingate by Wyndham Chandler | 64 |
| TOTAL | 3,898 |
Regional Comparison Data
Employers in Chandler recruit from a talented and diverse workforce. Within Chandler, educational attainment is well above regional, state and national levels. Beyond Chandler, the Greater Phoenix region offers a workforce of more than 2.5 million people.
High School Graduate
- 94% Chandler
- 91% Greater Phoenix
- 90% Arizona
- 90% United States
At Least Some College
- 77% Chandler
- 67% Greater Phoenix
- 66% Arizona
- 63% USA
Bachelor's Degree or Higher
- 48% Chandler
- 36% Greater Phoenix
- 34% Arizona
- 36% USA
Data Source: ESRI Business Analyst - Educational Attainment Ages 25+ (2023)
Chandler residents earn among the highest wages in the Greater Phoenix area. This buying power creates demand for quality retail establishments and first in market concepts.
Median Household Income
- Gilbert: $112,000
- Scottsdale: $107,285
- Chandler: $101,212
- Mesa: $72,241
- Phoenix: $71,736
- Tempe: $68,371
- Glendale: $65,889
Per Capita Income
- Scottsdale: $78,985
- Chandler: $49,949
- Gilbert: $49,004
- Tempe: $40,993
- Mesa: $38,385
- Phoenix: $37,939
- Glendale: $31,835
Data Source: ESRI Business Analyst (2023)
The numbers below were published in the Cost of Living Index, which reports on cost of living differences among 269 participating urban areas. The average for all places equals 100, and each participant's index is read as a percentage of the average for all places. While Greater Phoenix is currently just above the national average, cost of living is lower than most of our peer markets.
Greater Phoenix Cost of Living Index
- Composite Score: 101.7
- Groceries: 104.6
- Housing: 112.0
- Utilities: 98.1
- Transportation: 103.9
- Healthcare: 93.9
- Miscellaneous Goods & Services: 93.2
Source: Cost of Living Index (Q3 2023)
During a time of rising housing costs within our region and nationally, Greater Phoenix still compares favorably to most of our peer markets. The table below shows metro area Housing Opportunity Index (HOI) scores, which is the share of homes sold in that area that are affordable to a family earning the median income.
Percent of Homes Affordable for Median Income
(National Affordability Ranking)
- Chicago, IL: 48.8% (91)
- Washington, DC: 42.6% (111)
- Austin, TX: 35.3% (140)
- Dallas, TX: 27.3% (164)
- Phoenix, AZ: 24.9% (171)
- Denver, CO: 24.1% (173)
- Seattle, WA: 20.6% (194)
- Boston, MA: 20.0% (197)
- Portland, OR: 18.3% (203)
- Salt Lake City, UT: 17.5% (205)
- Las Vegas, NV: 15.0% (212)
- San Francisco, CA: 5.4% (233)
- San Diego, CA: 4.0% (239)
- Los Angeles, CA: 2.7% (241)
Source: National Association of Home Builders (Q3 2023)
Community Profile
For questions or additional information, contact:
Odette Moore
Economic Development Research Assistant
480-782-3038